Flood Modeling and Watershed Hazard Assessment — Opol
A watershed-scale flood assessment combining hydrological modeling, hydraulic simulation, land-use analysis, erosion assessment, and GIS-based hazard mapping.
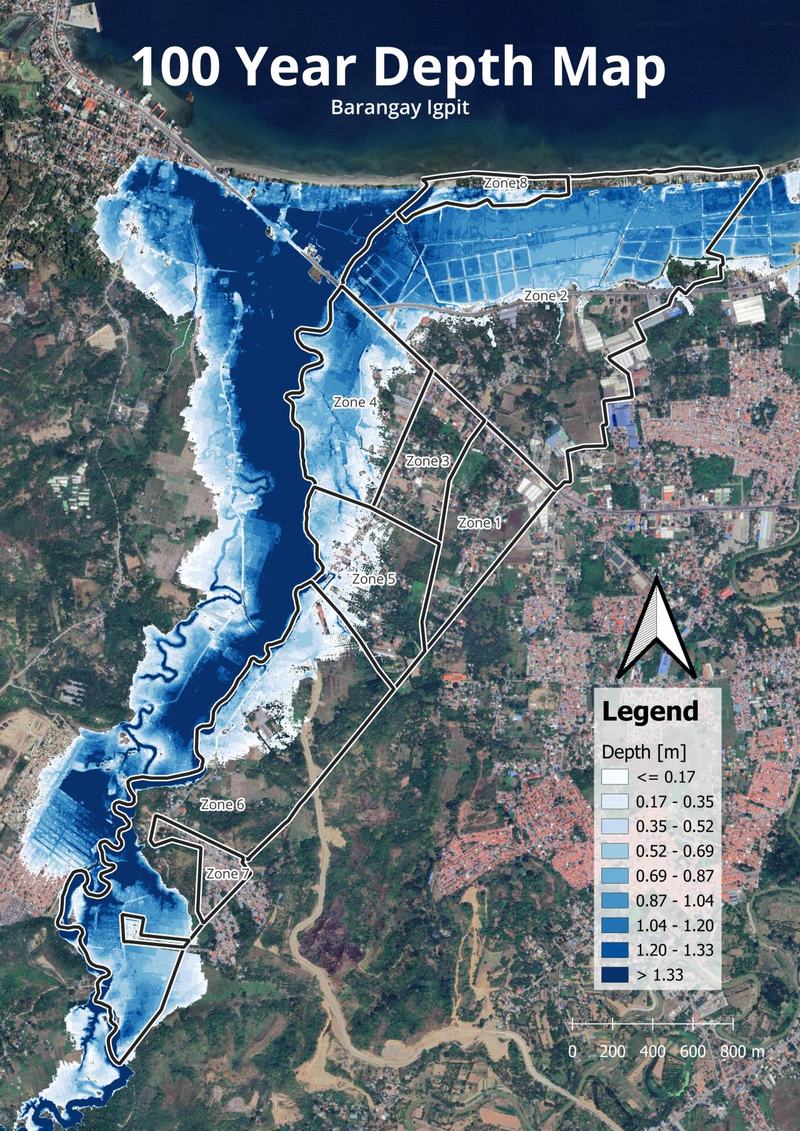
The Problem
Flooding is not caused by rainfall alone.
Land use, terrain, soil conditions, drainage patterns, erosion, and changes within the watershed all influence how quickly rainfall becomes runoff and how much water eventually reaches rivers and communities.
The challenge was to understand the entire watershed system rather than simply map locations that had previously experienced flooding.
Method
The analysis began in QGIS, where terrain, watershed boundaries, river networks, land use, soil, slope, and other spatial datasets were prepared and analyzed.
Watershed & Land-Use Analysis
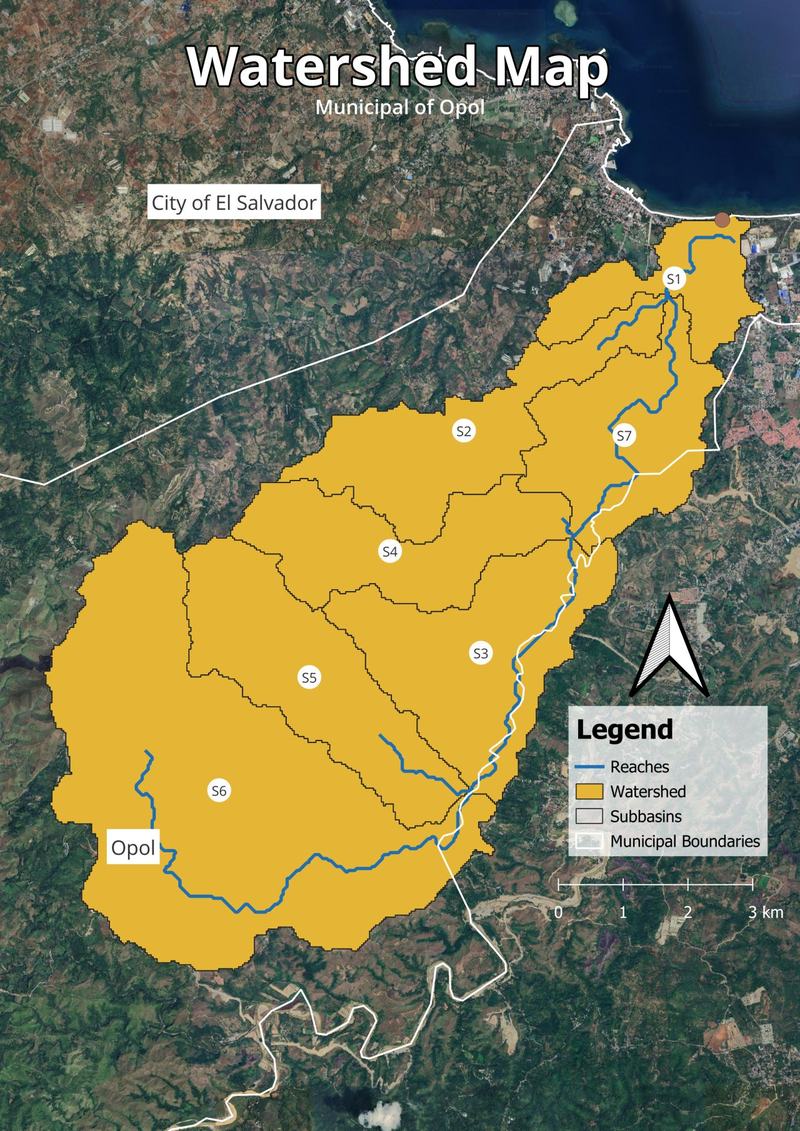
Land-use and land-cover data were analyzed to understand how developed areas, agricultural land, vegetation, and other surface conditions influence runoff.
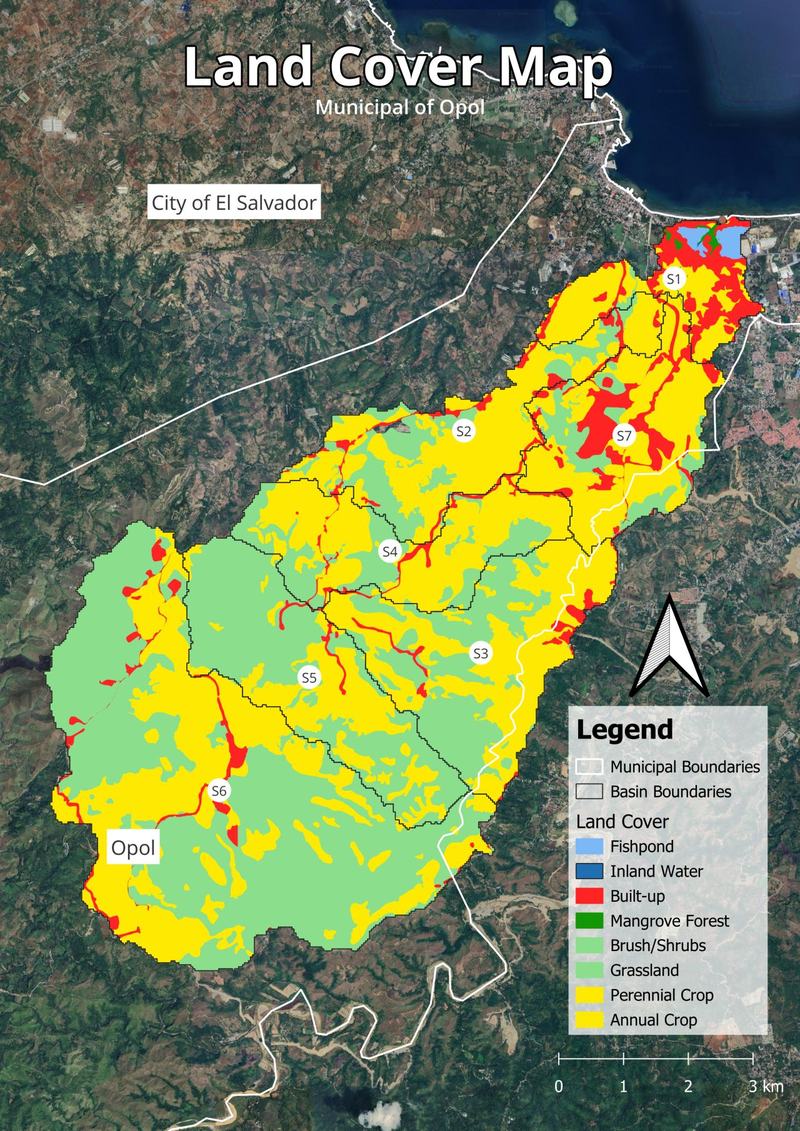
Terrain and drainage analysis were used to delineate the watershed, sub-basins, flow paths, slopes, and river networks.
Erosion Assessment
Erosion susceptibility was assessed using factors such as rainfall, soil characteristics, slope, land cover, and terrain conditions.
These layers helped identify areas where soil loss and sediment movement could contribute additional pressure to the watershed and river system.
Hydrological Modeling — HEC-HMS
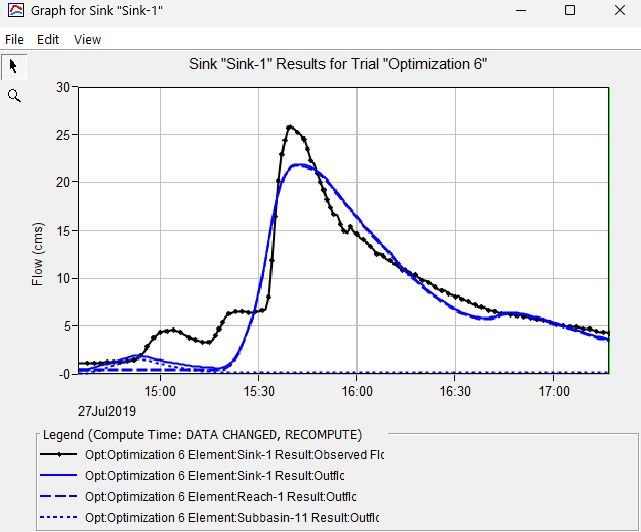
A HEC-HMS model was developed to simulate the rainfall-runoff process.
Watershed characteristics were translated into hydrological parameters to estimate runoff, peak discharge, and the timing of flows reaching the river network.
The model was calibrated and evaluated against available observed data, helping improve confidence that simulated watershed behavior represented actual conditions.
Hydraulic Modeling — HEC-RAS
Outputs from the hydrological model were used as inputs for HEC-RAS.
Hydraulic simulations were performed to understand how different river flows translate into water levels, flood depths, velocities, and floodplain extent.
Flood Hazard Rating
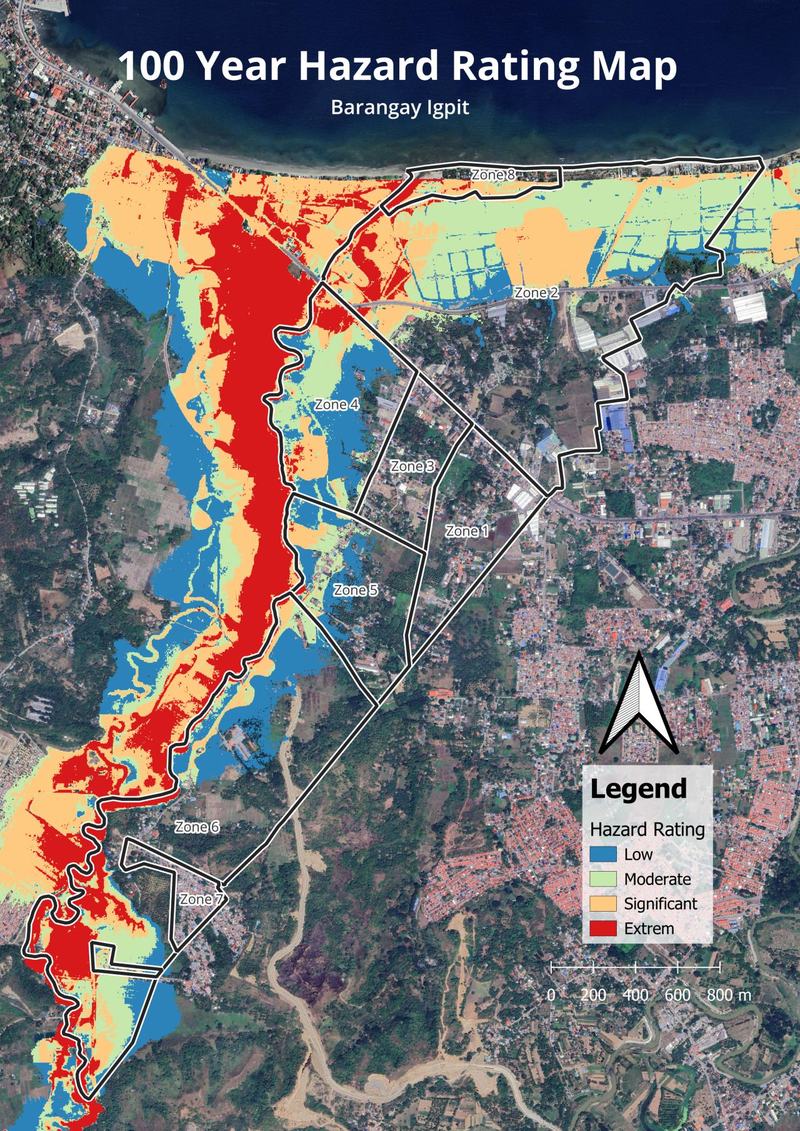
The hydraulic results were processed in QGIS and classified into flood hazard levels.
Flood depth, velocity, extent, and exposure could then be combined or categorized to distinguish lower-risk areas from locations experiencing more severe flood conditions.
The overall workflow connected:
Rainfall → Land Use & Terrain → Runoff → River Discharge → Hydraulic Simulation → Flood Depth & Velocity → Hazard Rating
Why
A flood map shows where water may go.
A watershed assessment helps explain why it gets there.
Combining land use, erosion, hydrology, hydraulic modeling, and GIS provides a more complete picture of how conditions upstream can influence flooding downstream.
This allows flood assessment to move beyond simply identifying inundated areas toward understanding the processes driving the hazard.
Solution
The project produced an integrated watershed and flood assessment that could support land-use planning, watershed management, flood mitigation, and disaster risk reduction.
By combining QGIS + Land-Use Analysis + Erosion Assessment + HEC-HMS + Model Calibration + HEC-RAS + Flood Hazard Rating, complex watershed processes were transformed into spatial information that planners and communities could interpret.
Testimonial
What They Said
"From rainfall in the watershed to understanding where, why, and how severely flooding can affect communities."