Southern Philippines 7.8 Earthquake
Interactive GIS story map documenting the June 8, 2026 magnitude 7.8 Southern Philippines earthquake using ArcGIS Maps SDK, React, TypeScript, and spatial visualization to communicate the event, epicenter, regional context, and earthquake awareness.
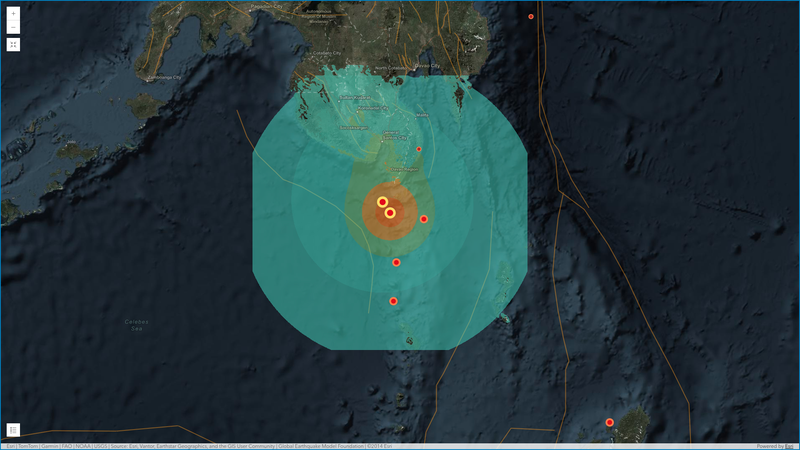
This project is an interactive GIS information-awareness application documenting the magnitude 7.8 earthquake that struck offshore of Sarangani in the southern Philippines on June 8, 2026, at 7:37 a.m. Philippine time. PHIVOLCS reported the epicenter approximately 32 km south-southwest of Maasim, Sarangani, with destructive shaking recorded in General Santos City and strong shaking across several areas of Mindanao.
The project was created as a contribution to public information and geographic awareness, using an interactive web mapping experience to communicate the event through maps, geographic context, and visual storytelling.
Interactive Earthquake Story Map
Rather than presenting the earthquake as a conventional static map, the project uses a story-map style interface to guide users through several geographic aspects of the event.
The application presents:
- Earthquake Headlines — Context and information surrounding the event
- Epicenter — Geographic location of the earthquake and its relationship to surrounding communities
- Ring of Fire — Regional tectonic context and the Philippines' position within the Pacific Ring of Fire
- Interactive Map — Geographic exploration through web-based GIS
- Visual Information — Supporting maps and graphics for communicating the event
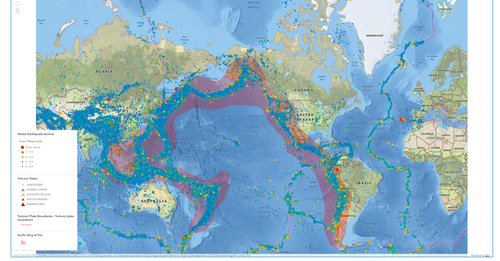
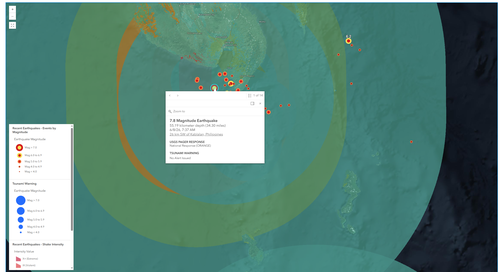
The objective is to make earthquake information easier to understand by connecting the event to its geographic location and regional context.
GIS & Spatial Visualization
The project uses the ArcGIS Maps SDK for JavaScript to create an interactive web mapping environment.
Instead of treating the map as a static image, the application allows geographic information to be presented through an interactive interface. This provides users with a way to explore the earthquake's location and surrounding geographic context directly through the browser.
The project demonstrates how GIS can be used not only for technical analysis, but also for public communication, information awareness, and geographic storytelling.
Technology Stack
The application was built using a modern web development stack:
- React 19 — Frontend application framework
- TypeScript — Type-safe application development
- ArcGIS Maps SDK for JavaScript — Interactive GIS mapping and spatial visualization
- Esri Calcite — UI components and interface design
- Vite — Fast frontend development and build tooling
- Vercel — Application deployment and hosting
The combination of React and the ArcGIS Maps SDK allows the project to bring together traditional GIS capabilities with a modern component-based web application.
Map & Interface Design
The interface was designed around the idea of progressive geographic storytelling.
Rather than presenting all information at once, the application separates the event into different views that help users understand:
What happened → Where did it happen → What areas were affected → What is the broader geographic context?
The map becomes the primary medium for communicating the event, while the surrounding interface provides supporting information and visual context.
Earthquake Context
The event triggered tsunami warnings for several coastal areas of Mindanao. PHIVOLCS later canceled the tsunami warning after monitoring indicated that the observed waves were too small to cause damage.
The earthquake was felt across multiple parts of Mindanao, with PHIVOLCS reporting Intensity VII in General Santos City, Intensity VI in parts of Sultan Kudarat, and Intensity V in several other locations.
These geographic differences provide an important reason for presenting the event spatially: the earthquake was not simply a single point on a map, but an event experienced across a wider geographic region.
Why This Project Exists
The project explores how web GIS can be used for rapid geographic communication during significant natural events.
Earthquake information is often distributed through separate news reports, bulletins, maps, and social media posts. An interactive GIS application can bring geographic context into a single experience.
The goal of this project is therefore not to replace official disaster information or emergency-management systems. Instead, it demonstrates how GIS and modern web technologies can be used to create an accessible information-awareness layer that helps people understand an event geographically.
Project Architecture
The application follows a modern frontend architecture:
React → TypeScript → ArcGIS Maps SDK → Interactive Map Components
Vite provides the development and build environment, while Esri Calcite provides reusable interface components for the application.
The resulting application is deployed through Vercel, providing a lightweight way to publish the interactive GIS experience to the web.